Excel Mastery: Crush Your Spreadsheets Like a Pro! – Part 1 What is Excel?
Excel Mastery: Crush Your Spreadsheets Like a Pro!
Part 1 What Microsoft Excel is and its Importance
 Alright folks, it’s time to talk about the big kahuna of spreadsheet software: Microsoft Excel. You may be thinking, “Why on earth would I want to read about Excel? It’s just a boring program for number nerds!” But hold your horses, because there’s a lot more to Excel than meets the eye.
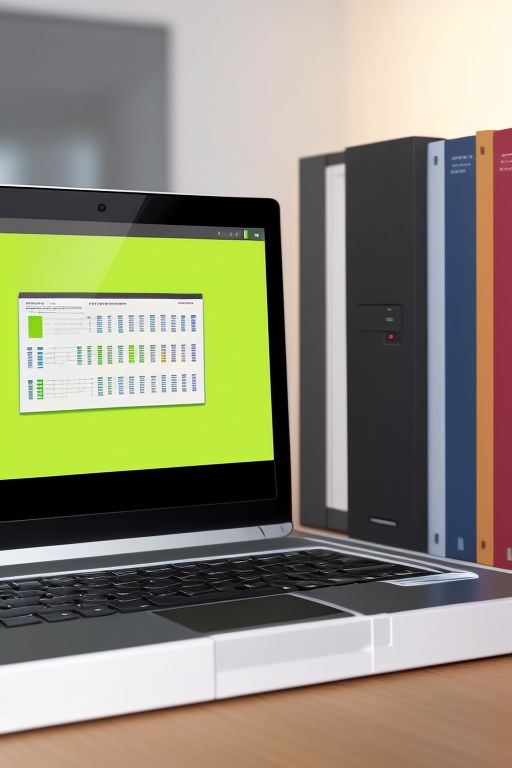
First off, let’s talk about what Excel actually is. At its core, it’s a program that lets you store, organize, and manipulate data. But that’s like saying a Ferrari is just a car that gets you from point A to point B. Excel is so much more than that. It’s a powerful tool that can help you make sense of even the messiest of data.
For all you finance, accounting and number crunching folks out there, Excel is your best friend. It can handle large amounts of data with ease, and it has all sorts of fancy functions and formulas to help you analyze that data (which we will be getting into). But Excel isn’t just for the calculator crunchers. It’s also great for creating all sorts of visualizations, from sales dashboards to project timelines.
One of the best things about Excel is how versatile it is. You can import data from all sorts of different sources, like databases and other programs. You can also use Excel to export data. You can even create 3D graphs with your data. Yes, you read that right, 3D graphs in Excel (which is something else we will be getting into later). And the best part? Excel plays nice with all sorts of different file formats, so you don’t have to worry about compatibility issues, even if you are sending those 3D graphs to clients. Believe it or not, 99% of people can open up an Excel document even if they don’t have Excel. (That is not a real verified number, just one that sounded good – though if it were put to the test my guess is that it would be correct). Google Sheets, which is completely free, can open up Excel documents without a single hiccup!
So if Google Sheets can open Excel docs, why not use Google Sheets? Well, because Google Sheets cannot do everything that we are covering in this series of post. Not only that, Google Sheets is quite limited when it comes to custom functions and coding, while Excel’s VBA is pretty much a wide open field. For now, just know, we are using Excel because we are using Excel. Just like my parents always told me, ‘Don’t question what I say, just do what I tell you!’. I am here to say that I never took that advice.
Video from Excel Unusual Rollercoaster Excel demo.
Main Site
So there you have it, folks. Microsoft Excel: not just for number nerds anymore. But, if you have made it this far then you probably already know that, or you are being forced to read this to gain valuable insight on something that this text is offering. Either way, give Excel a try by following along with me and see just how powerful this program can be. Who knows, you might just find yourself having fun with it.
In the next post we will be covering the basics of Excel and the magic you can do with it (starting off anyway).
Next Post


